Automated Financial Analysis Explained for Finance Teams
Automated Financial Analysis Explained for Finance Teams

Automated financial analysis is the use of AI-powered modular pipelines to ingest, validate, compute, detect anomalies, and report financial data without manual intervention at each stage. Finance professionals who understand this process gain a direct advantage: faster close cycles, fewer spreadsheet errors, and board-ready reports generated in minutes rather than days. Tools like UiPath RPA, Oracle Fusion Cloud EPM, and open-source FP&A agents now make this architecture accessible to teams of every size. The core benefit is not just speed. It is the ability to shift analyst time from data wrangling to actual decision support.
What is automated financial analysis explained as a system?
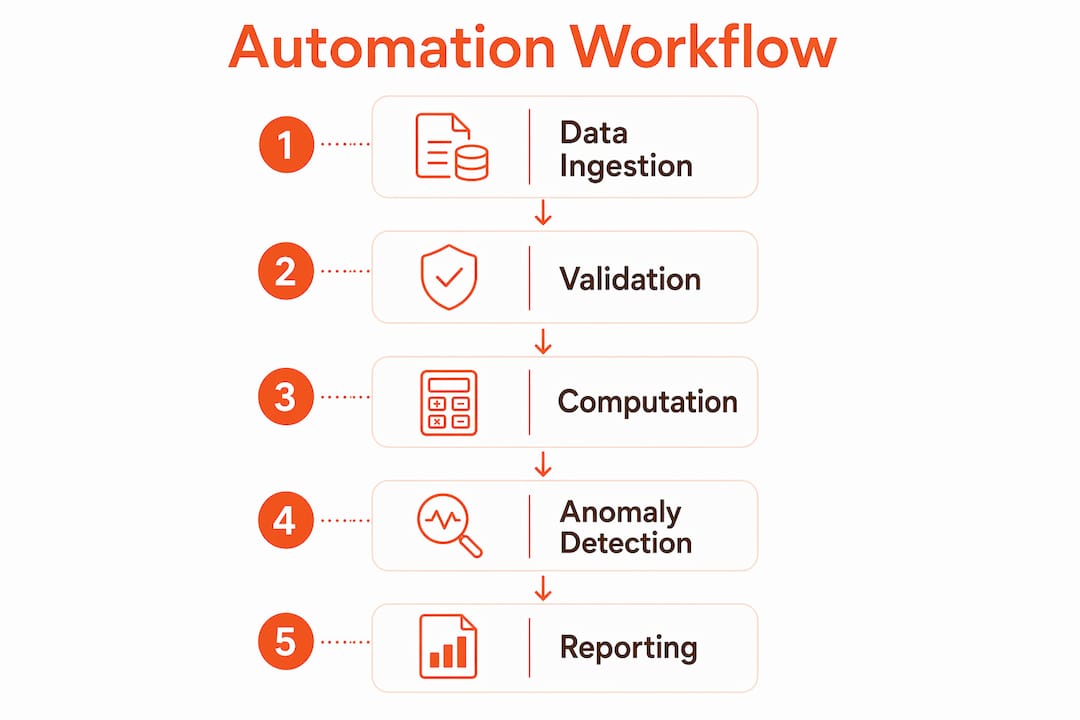
Automated financial analysis is best understood as a modular pipeline architecture where each stage performs a discrete function before passing output to the next. The stages are data ingestion, validation, computation, anomaly detection, and reporting. Each stage is independent, which means a failure or update in one module does not corrupt the others. That separation is what makes these systems reliable at scale.
The modular design also matters for SMEs. A lightweight RPA framework built for spreadsheet-centric businesses executes these steps sequentially, reducing errors and improving scalability without requiring enterprise-grade infrastructure. Finance teams running Excel-based workflows can adopt this architecture incrementally, one module at a time.

Understanding financial automation at this level clarifies why generic “automate your reports” advice falls short. The real gains come from correctly separating data handling from analytics logic. Separating these two layers reduces downstream errors and makes each module easier to audit and maintain.
What are the core workflow steps in financial analysis automation?
A well-designed financial analysis automation system follows a clear sequence. Each step builds on the last, and skipping any one of them creates gaps that surface later as unexplained variances or audit failures.
-
Data ingestion. The system pulls structured and unstructured financial data from ERP systems, spreadsheets, and document sources. UiPath RPA handles this layer well for spreadsheet-heavy environments.
-
Validation and standardization. Inputs are checked for completeness, format consistency, and referential integrity. This step catches upstream data quality issues before they reach computation.
-
Financial computation and KPI derivation. The engine calculates ratios, period-over-period changes, and KPIs from validated data. SQL-based variance engines are common at this stage.
-
Anomaly detection. Machine learning models, specifically Isolation Forest algorithms, flag statistical outliers. An open-source FP&A agent on GitHub reduces analysis time from hours to minutes using this approach.
-
Structured reporting and alerts. The system generates formatted outputs, triggers threshold-based alerts, and routes notifications to the right reviewers.
The table below maps each stage to its primary function and a representative tool or method.
| Stage | Primary function | Representative tool or method |
|---|---|---|
| Data ingestion | Pull and consolidate financial data | UiPath RPA, SQL connectors |
| Validation | Check format, completeness, integrity | Rule-based validation scripts |
| Computation | Calculate KPIs and period variances | SQL variance engine |
| Anomaly detection | Flag statistical outliers | Isolation Forest (ML) |
| Reporting | Generate formatted outputs and alerts | Oracle GenAI, Excel export |
Pro Tip: Build each module with a defined input schema and output schema. When a module fails, you can swap it out without rewriting the entire pipeline.
How does automated variance analysis answer the “why” behind the numbers?
Variance analysis is the process of explaining why actual financial results differ from budget or prior period figures. Manual variance analysis typically takes 3–5 days per reporting cycle. AI variance analysis compresses this into near-real-time by automatically attributing differences to price, volume, and mix drivers across multiple data sources simultaneously.
The price/volume/mix framework is the standard decomposition method. Price variance measures the impact of rate changes. Volume variance isolates the effect of quantity changes. Mix variance captures shifts in the composition of revenue or cost. Automating this decomposition requires the system to reason across planning data, actuals, and operational records at the same time.
The practical output is a board-ready explanation, not just a number. A finance analyst reviewing an automated variance report sees a statement like “Revenue shortfall of $2.4M driven 60% by volume decline in the enterprise segment and 40% by a price reduction in Q1 contracts.” That level of specificity used to require a senior analyst spending a full day pulling data.
Consistency is the hidden benefit here. Variance playbooks that map drivers to specific accounting taxonomy lines produce the same explanation logic every reporting cycle. Human analysts make judgment calls that vary by person and by deadline pressure. Automated systems apply the same rules every time.
-
Automated P/V/M attribution removes the subjectivity of manual driver assignment.
-
Cross-process reasoning connects planning assumptions to operational outcomes.
-
Near-real-time output means finance teams can respond to variances within the same reporting period.
-
Consistent driver logic makes variance explanations comparable across quarters and business units.
Pro Tip: Build your variance playbook before you configure the automation. Define exactly which drivers apply to each reporting line item and map them to your chart of accounts. Retrofitting this logic after deployment is significantly harder.
What role does anomaly detection play in automated financial reporting?
Anomaly detection in financial analysis uses machine learning to identify data points that fall outside expected statistical ranges. The Isolation Forest algorithm is the most widely used method for this purpose in FP&A systems. It works by isolating observations that require fewer splits in a decision tree, which makes outliers computationally cheap to find.
The challenge with anomaly detection is false positives. A system that flags too many normal transactions as anomalies creates alert fatigue and erodes analyst trust. The solution is a two-step approach: check data stability first, and only run the detection model if the data shows meaningful variation. If the data is stable, the system returns zero anomalies without running the full model. Adaptive contamination scaling then adjusts the sensitivity threshold based on data characteristics.
Generative AI adds a second layer of value after anomaly detection. Oracle’s GenAI narrative generation, implemented in Oracle Fusion Cloud EPM, uses conditional text templates to produce narrative summaries at the row, column, or cell level. The system triggers a narrative when a defined condition is met, such as a variance exceeding a set threshold.
-
Isolation Forest flags outliers without requiring labeled training data.
-
Adaptive thresholding reduces false positives by scaling contamination parameters to data volume.
-
Oracle GenAI generates draft management commentary from structured financial data.
-
All AI-generated narratives require human review before they inform final decisions.
Pro Tip: Treat AI-generated narratives as a first draft, not a final output. Review every narrative for context that the model cannot access, such as one-time items, strategic decisions, or external market events.
How is auditability built into automated financial analysis workflows?
Auditability is not optional in financial reporting. Every automated output must be traceable to its source data, the rules applied, the calculations performed, and the human who approved the result. A complete audit trail includes source data references, applied logic, exceptions flagged, reviewer approvals, and recorded overrides.
The governance model that works in practice is “agent-prepared, human-approved.” The AI system prepares the analysis, flags anomalies, and generates commentary. A qualified human reviews the output, records any challenges or overrides, and approves the final version. That approval is logged with a timestamp and reviewer identity. This model keeps AI in a support role while maintaining clear human accountability.
Opaque AI outputs are a compliance risk. If a finance team cannot explain how a number was produced, auditors will not accept it. Human governance remains essential even when AI prepares the work. The Maxima AI approach makes this explicit: every agent action is logged, every exception is documented, and every approval is recorded before the output reaches a financial statement.
-
Source data references link every computed figure back to its origin.
-
Applied rules are stored as versioned logic, not embedded in opaque model weights.
-
Reviewer approvals create a defensible chain of custody for each output.
-
Override records show where human judgment replaced automated conclusions.
Finance teams that build auditability into their automation from day one avoid costly retrofits when regulators or external auditors request evidence. You can explore real AI deployment examples to see how evidence chains are structured in practice.
What are the practical benefits and limitations finance professionals should know?
The benefits of automated financial analysis are well-documented. RPA applied to financial analytics can reduce error exposure by up to 95% while cutting reporting latency substantially. For SMEs, the cost advantage is significant because the system scales linearly with data volume without adding headcount.
Integration with existing systems is the most common implementation challenge. Finance teams running SAP, Oracle, or Microsoft Dynamics need connectors that map their data structures to the automation pipeline’s input schema. Teams running spreadsheet-based workflows can use lightweight RPA frameworks that treat Excel files as data sources. Neither path is trivial, but both are well-supported by current financial data analysis software.
The limitations are real and worth naming directly. False-positive anomaly alerts remain a problem in systems with noisy or inconsistent historical data. AI-generated narratives miss context that only humans hold. And automation does not fix bad data. A pipeline fed with inconsistent chart-of-accounts mappings will produce fast, confident, wrong answers.
-
Automation reduces manual error and reporting time across the close cycle.
-
Integration complexity depends on the maturity of existing data infrastructure.
-
False positives require tuned contamination parameters and human review protocols.
-
AI commentary needs expert verification before it reaches executives or the board.
The financial analysis tools available today, from open-source FP&A agents to Oracle Fusion Cloud EPM, cover the full pipeline. The right choice depends on your data environment, governance requirements, and the complexity of your variance reporting needs.
Key takeaways
Automated financial analysis delivers the most value when modular pipeline design, variance playbooks, and human governance are built in from the start, not added later.
| Point | Details |
|---|---|
| Modular pipeline design | Separate data ingestion, validation, computation, anomaly detection, and reporting into discrete modules. |
| Variance playbooks are required | Map price, volume, and mix drivers to accounting taxonomy lines before configuring automation. |
| Anomaly detection needs tuning | Use adaptive contamination scaling and data stability checks to reduce false positives. |
| AI prepares, humans approve | Log every AI output, reviewer decision, and override to maintain a defensible audit trail. |
| Integration determines success | Match your automation framework to your existing data infrastructure, whether ERP or spreadsheet-based. |
Where automation ends and judgment begins
Finance automation has accelerated faster in the past three years than in the previous decade. I have watched teams cut their monthly close from twelve days to four using modular RPA pipelines. The speed gains are real. What concerns me is the assumption that speed equals accuracy.
The governance piece is where most implementations go wrong. Teams deploy anomaly detection and narrative generation, then treat the outputs as finished work. They are not. AI prepares the analysis. A qualified human must review it, challenge it, and approve it. That step is not bureaucratic overhead. It is the only thing standing between a fast wrong answer and a defensible financial statement.
The skill set finance professionals need is shifting. Understanding how Isolation Forest works, what a variance playbook encodes, and why conditional text templates need human verification is now baseline knowledge for senior analysts. These are not IT skills. They are finance skills applied to a new class of tools.
My honest view: the teams that will get the most from financial analysis automation are not the ones with the most sophisticated AI. They are the ones with the clearest governance protocols and the most disciplined data practices. Automation amplifies what is already there. If your data is clean and your logic is documented, automation makes you faster and more accurate. If neither is true, it makes you wrong at scale.
— Rohan
How Arosplatforms supports financial analysis automation
Finance teams building or upgrading automated analysis systems need more than software. They need an implementation partner who understands both the technical architecture and the governance requirements specific to financial workflows.

Arosplatforms builds customized AI operating systems for finance and other industries, embedding directly within client operations to address specific workflow challenges. From modular pipeline design to anomaly detection tuning and audit trail configuration, Arosplatforms aligns its solutions with the governance and reporting standards finance teams actually face. Clients report an average of 82% faster turnaround on key tasks, with many reaching ROI within twelve months. Explore AI consulting by market to see how Arosplatforms structures engagements for finance sector automation, or review the platforms and technology that power these deployments.
FAQ
What is automated financial analysis?
Automated financial analysis is the use of AI-powered modular pipelines to ingest, validate, compute, detect anomalies, and report financial data without manual processing at each stage. It replaces repetitive analyst tasks with software-driven workflows that produce consistent, auditable outputs.
How does variance analysis work in automated systems?
Automated variance analysis attributes budget-versus-actual differences to price, volume, and mix drivers using SQL-based engines and predefined variance playbooks. This process compresses what previously took 3–5 days into near-real-time output.
What is the Isolation Forest method in financial anomaly detection?
Isolation Forest is a machine learning algorithm that identifies statistical outliers by measuring how few decision-tree splits are needed to isolate a data point. Financial automation systems use it with adaptive contamination scaling to reduce false-positive alerts.
Why is human review still required in automated financial reporting?
AI systems prepare analysis but cannot account for one-time items, strategic decisions, or external context that only humans hold. The “agent-prepared, human-approved” governance model ensures every output is reviewed, challenged if needed, and logged before it reaches a financial statement.
What financial data analysis software supports full pipeline automation?
Oracle Fusion Cloud EPM supports generative AI narrative generation. Open-source tools like the FP&A agent on GitHub cover SQL variance engines, Isolation Forest anomaly detection, and Excel reporting. UiPath RPA handles data ingestion for spreadsheet-centric environments.